


DDEP a factor for the subdued performance of financial stocks on the Ghana Stock Exchange
The dynamic of the market witnessed its highest daily performance on March 24th but lower peak returns in subsequent days for the period under review. Despite the existing macroeconomic challenges, the performance in the first quarter of 2023 has been remarkable. However, there is potential for even greater returns by carefully selecting an optimal portfolio mix.
March witnessed a notable surge in the GSE Composite Index (GSE-CI), which recorded a 14.01% increase compared to the previous month, resulting in a year-to-date gain of 12.33%. This upward trend in the GSE-CI was primarily driven by strong price gains in certain shares, as well as investors’ interest in diversifying their portfolios. The trading activity also experienced a significant boost, with trading volumes soaring by 2,730% and trading values increasing by 588% compared to the previous month. This spike can be largely attributed to block trades involving MTN Ghana shares. Among the top performers for the month, TOTAL (39.82%), MTNGH (35.87%), UNIL (33.78%), BOPP (20.93%), and GGBL (9.49%) stood out as the stocks with the highest price gains.

This section reports on the various indices performance and overall markets assessment for the period under review.

Figure 1.1 Indices
The Ghana Stock Exchange Composite Index, which serves as the primary indicator of equity performance, experienced a significant growth of 12.3 percent on a year-on-year basis during the first quarter of 2023 compared to the same period in 2022. With a value of 2,745.33 points, the Q1-2023 GSE-CI demonstrated the second-highest performance in the past thirteen years, surpassed only by the record-high of 2,789.34 points achieved in Q1-2021. Despite a slight decline of approximately 1.6 percent from the YoY highest level, the market exhibited a commendable performance.
Following a strong performance at the end of Q1-2021, the Ghana Stock Exchange Financial Stock Index experienced a downward trend after the implementation of the Domestic Debt Exchange Programme. This initiative had a negative impact on investor interest in the Financial Sector, leading to a decrease in both bid and ask prices for stocks within that sector. Consequently, the index declined by 11.98 percent, dropping from 2052.59 points in Q1-2022 to 1806.67 points in Q1-2023. This represents one of the poorest performances observed since the index’s establishment in 2011, reflecting a significant loss of investors’ confidence in the market.
Despite the underperformance of the financial sector, the overall market performance in Q1-2023 stood out as one of the strongest during the period compared to Q1 of other years. The Financial sector’s lackluster performance had minimal influence on the broader market, indicating that other sectors contributed significantly to the positive performance observed.
Table 1.4.1
| INDICATORS | Q1 – 19 | Q1 – 20 | Q1 – 21 | Q1 – 22 | Q1 – 23 |
| GSE Composite Index Level | 2,454.51 | 2,159.61 | 2,213.29 | 2,742.85 | 2,745.33 |
| GSE Composite Index YTD | -4.58% | -4.32% | 13.99% | -1.67% | 12.33% |
| GSE Financial Stock Index Level | 2,155.29 | 1,922.92 | 1,845.92 | 2,174.96 | 1,806.67 |
| GSE Financial Stock Index YTD | 0.07% | -4.79% | 3.54% | 1.07% | -11.98% |
| Market Capitalization (GH¢) | 59,750.01 | 55,985.55 | 57,162.18 | 64,029.79 | 67,846.89 |
| Domestic Capitalization (GH¢) | 24,231.21 | 22,430.65 | 20,388.88 | 28,771.40 | 29,382.45 |
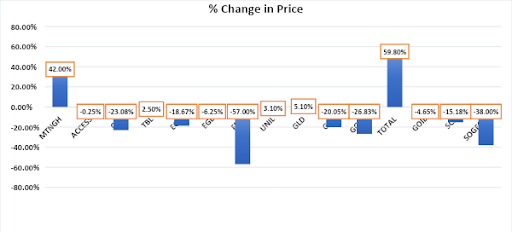
Out of the 39 stocks traded during the quarter, 15 experienced price fluctuations, while the remaining 24 remained relatively stable. Despite certain market indices experiencing declines, the quarter concluded with 5 stocks showing gains, while 10 stocks registered losses. Notably, the majority of these indices originated from the Finance sector.
Amid declining stock prices, a few stocks stood out by generating returns for investors. TOTAL took the lead by providing a significant 59.8 percent return on capital, while MTN secured the second spot with a 42 percent return. The remaining three gainers yielded gains of less than 6 percent. These equities’ ability to deliver positive returns can be attributed to the strong performance witnessed in the first quarter of 2023, which instilled confidence in investors and subsequently drove up the bid and ask prices on the stock exchange.
Table 2.1.1
| Movers | ||||
| Ticker | Year Open Prices (GH¢) | Q1 – 2023 Prices (GH¢) | Change | % Change |
| MTNGH | 0.88 | 1.25 | 0.370 | 42.0% |
| TBL | 0.80 | 0.82 | 0.020 | 2.5% |
| TOTAL | 4.00 | 6.39 | 2.390 | 59.8% |
| UNIL | 3.88 | 4.00 | 0.120 | 3.1% |
| GLD | 217.80 | 229.00 | 11.200 | 5.1% |
During the first quarter, the financial sector suffered a significant setback with 8 out of the 10 worst performers originating from that sector. The decline in share prices across multiple indices was a gradual process that started after the implementation of the Debt exchange program. As investors anticipated a decline in the financial sector’s performance and profitability, their confidence in purchasing bank shares on the exchange waned. Consequently, there was a noticeable decrease in trading activity related to the financial indices over time.
Table 2.2.1
| Losers | ||||
| Ticker | Year Open Prices (GH¢) | Q1 – 2023 Prices (GH¢) | Change | % Change |
| ACCESS | 4.01 | 4.00 | (0.010) | -0.25% |
| CAL | 0.65 | 0.50 | (0.150) | -23.08% |
| EGH | 6.64 | 5.40 | (1.240) | -18.67% |
| EGL | 3.20 | 3.00 | (0.200) | -6.25% |
| FML | 3.00 | 1.29 | (1.710) | -57.00% |
| GCB | 3.94 | 3.15 | (0.790) | -20.05% |
| GGBL | 2.05 | 1.50 | (0.550) | -26.83% |
| GOIL | 1.72 | 1.64 | (0.080) | -4.65% |
| SCB | 20.16 | 17.10 | (3.060) | -15.18% |
| SOGEGH | 1.00 | 0.62 | (0.380) | -38.00% |
Table 2.3.1
| No Change | |||
| Ticker | Year Open Prices (GH¢) | Q1 – 2023 Prices (GH¢) | Change |
| ADB | 5.06 | 5.06 | 0.000 |
| AGA | 37.00 | 37.00 | 0.000 |
| ALW | 0.10 | 0.10 | 0.000 |
| ASG | 8.87 | 8.87 | 0.000 |
| CLYD | 0.03 | 0.03 | 0.000 |
| CMLT | 0.10 | 0.10 | 0.000 |
| CPC | 0.02 | 0.02 | 0.000 |
| DASPHARMA | 0.40 | 0.40 | 0.000 |
| ETI | 0.15 | 0.15 | 0.000 |
| MAC | 5.38 | 5.38 | 0.000 |
| PBC | 0.02 | 0.02 | 0.000 |
| RBGH | 0.54 | 0.54 | 0.000 |
| SIC | 0.31 | 0.31 | 0.000 |
| SWL | 0.05 | 0.05 | 0.000 |
| TLW | 11.92 | 11.92 | 0.000 |
| AADS | 0.41 | 0.41 | 0.000 |
| SCB PREF | 0.90 | 0.90 | 0.000 |
| SAMBA | 0.55 | 0.55 | 0.000 |
| MMH | 0.11 | 0.11 | 0.000 |
| HORDS | 0.10 | 0.10 | 0.000 |
| IIL | 0.04 | 0.04 | 0.000 |
| DIGICUT | 0.09 | 0.09 | 0.000 |
| POP | 0.68 | 0.68 | 0.000 |
Over the past 52 weeks, the stock market has experienced a mix of gains and losses, providing a balanced view of investment outcomes. Among the various stocks, two have stood out by delivering capital gains exceeding 40 percent. One of these stocks is MTN, a publicly traded company initially incorporated in Ghana in April 1994 and listed on the Ghana Stock Exchange (GSE) since September 3rd, 2018. MTN has met investors’ expectations to a significant extent, with its share price increasing from GHS 1.06 to GHS 1.25 over the course of 52 weeks. Notably, one unique aspect of this stock is its reliance on the management’s expertise in investing in competitive and high-yielding stocks. As a result, investors indirectly depend on the professional acumen of MTN’s managers when purchasing this stock. Furthermore, MTN has been the most actively traded stock in the first quarter of 2023, which can be attributed to its impressive operational performance and profitability throughout the year, leading to a notable year-to-date return of 17.92 percent on capital gains. The potential of MTN should not be underestimated, especially considering its current status as the most traded stock on the market.
Another noteworthy stock is Benso Oil Palm Plantation (BOPP), which ranks as the 14th most traded stock on the Ghana Stock Exchange(In terms of volume traded) in the last three months (Jan. 26–Apr. 28, 2023). During this period, BOPP has recorded an average daily trading volume of 541 shares, totaling 34,071 shares valued at GHS 381,114. BOPP has emerged as one of the market’s top-performing stocks in terms of capital gains, providing investors with an impressive return of 94 percent over the past 52 weeks. This success can be attributed to BOPP’s effective management expertise and strategic focus on export strategies.
Table 3.1.1
| Gainers | ||||
| Ticker | Q1 – 22 | Q1 – 23 | Change | % Change |
| ACCESS | 2.09 | 4.00 | 1.91 | 91.39% |
| BOPP | 6.00 | 11.67 | 5.67 | 94.50% |
| MTNGH | 1.06 | 1.25 | 0.19 | 17.92% |
| SIC | 0.22 | 0.31 | 0.09 | 40.91% |
| TBL | 0.40 | 0.82 | 0.42 | 105.00% |
| TOTAL | 5.02 | 6.39 | 1.37 | 27.29% |
| GLD | 158.60 | 229.00 | 70.40 | 44.39% |
| POP | 0.66 | 0.68 | 0.02 | 3.03% |
A caution to sell shares is presented to the typical investor when they experience a 52-week loss on the stock market. To determine whether specific equity is headed for further decline, it is important to analyze price movements and understand the nature of the swings. Although CAL, EGH, EGL, GCB, and other banks delivered impressive performances in 2022, they have subsequently experienced a decrease in capital gains since the introduction of Debt exchange programs.
Table 3.2.1
| Losers | ||||
| Ticker | Q1 – 22 | Q1 – 23 | Change | YTD Change(%) |
| CAL | 0.86 | 0.50 | -0.36 | -41.86% |
| CMLT | 0.11 | 0.10 | -0.01 | -9.09% |
| EGH | 7.60 | 5.40 | -2.20 | -28.95% |
| EGL | 3.30 | 3.00 | -0.30 | -9.09% |
| ETI | 0.17 | 0.15 | -0.02 | -11.76% |
| FML | 3.00 | 1.29 | -1.71 | -57.00% |
| GCB | 5.16 | 3.15 | -2.01 | -38.95% |
| GGBL | 2.25 | 1.50 | -0.75 | -33.33% |
| GOIL | 1.82 | 1.64 | -0.18 | -9.89% |
| MAC | 5.39 | 5.38 | -0.01 | -0.19% |
| RBGH | 0.60 | 0.54 | -0.06 | -10.00% |
| SCB | 20.30 | 17.10 | -3.20 | -15.76% |
| SOGEGH | 1.19 | 0.62 | -0.57 | -47.90% |
| UNIL | 5.89 | 4.00 | -1.89 | -32.09% |
| IIL | 0.05 | 0.04 | -0.01 | -20.00% |
On the flip side, there was a notable level of trading activity in the market, with more than 181 million shares valued at over GHS 199 million being exchanged. It is important to highlight that the decline in share prices across the financial sector indices, as well as select indices in other sectors, had a significant impact on the overall trading volume and value within their respective sectors. However, amidst these developments, certain indices, including MTN, BOPP, TBL, and others, experienced price increases, resulting in a remarkable 6 percent expansion of the total market capitalization.
Table 4.1
| Indicators | Q1 -22 | Q1 – 23 | YOY Change |
| Volume Traded | 280,656,909 | 181,344,788 | -35.39% |
| Value Traded | 301,850,157.39 | 199,048,178.41 | -34.06% |
| Average Daily Volume Traded | 4,600,933 | 2,924,916 | -36.43% |
| Average Daily Value Traded | 4,948,363.24 | 3,210,454.49 | -35.12% |
| Number of Trading Days | 61 | 62 | |
| Number of symbols Traded | 33 | 30 |
Table 4.2
| Sector | Q1 – 2022 | Q1 – 2023 | Change in market Cap. | ||||
| Volume Traded | Value Traded | Market Cap. (GH¢ mil) | Volume Traded | Value Traded | Market Cap. (GH¢ mil) | ||
| FINANCE | 13,029,112 | 16,861,311.33 | 14,811.61 | 2,864,096 | 7,149,045.45 | 12,392.11 | -16.34% |
| DISTRIBUTION | 1,291,911 | 1,223,896.28 | 1,284.40 | 559,324 | 1,423,891.43 | 1,367.13 | 6.44% |
| FOOD AND BEVERAGE | 5,153,852 | 11,104,999.66 | 1,096.25 | 6,108,364 | 9,709,522.15 | 666.84 | -39.17% |
| ICT | 248,748,578 | 265,129,417.49 | 13,028.92 | 171,045,195 | 155,542,241.34 | 15,364.11 | 17.92% |
| INSURANCE | 12,271,821 | 4,251,624.76 | 606.99 | 383,583 | 125,162.27 | 573.33 | -5.55% |
| MANUFACTURING | 82,180 | 323,626.11 | 440.48 | 230,793 | 597,555.10 | 319.7 | -27.42% |
| MINING | 8,011 | 4,262.86 | 32,530.27 | 19,034 | 171,282.97 | 36,072.18 | 10.89% |
| AGRICULTURE | 54,956 | 336,022.10 | 208.8 | 29,264 | 278,504.90 | 406.12 | 94.50% |
| EXCHANGE TRADED FUNDS (ETF) | 16,488 | 2,614,996.80 | 0.79 | 105,035 | 24,050,963.80 | 664.1 | 83963.29% |
| EDUCATION | 0 | 0.00 | 10.57 | 0 | 0.00 | 10.57 | 0.00% |
| ADVERTISEMENT & PRODUCTION | 0 | 0.00 | 10.70 | 100 | 9.00 | 10.7 | 0.00% |
Table 4.3
| Volume Traded | Value Traded (GH¢) | GSE-CI | Mkt.Cap(GH¢) | |
| January | 1,549,671 | 6,670,634.64 | 2,354.02 | 63,706.71 |
| February | 6,136,508 | 24,407,843.29 | 2,408.33 | 64,235.77 |
| March | 173,658,609 | 167,969,700.48 | 2,745.33 | 67,846.89 |
| TOTAL | 181,344,788 | 199,048,178 | – | – |


Table 5.1
| Interest rate | ||||
| Dates | 91 Days | 182 days | 1yr Note | 2yr Note |
| 06-Jan-23 | 35.36% | 24.36% | 35.89% | 24.25% |
| 13-Jan-23 | 35.69% | 24.65% | 35.91% | 23.00% |
| 20-Jan-23 | 35.63% | 24.38% | 35.56% | 23.00% |
| 27-Jan-23 | 35.71% | 24.45% | 35.81% | 23.00% |
| 03-Feb-23 | 35.74% | 24.19% | 35.81% | 23.00% |
| 10-Feb-23 | 35.73% | 24.62% | 35.62% | 24.05% |
| 17-Feb-23 | 35.68% | 24.57% | 35.62% | 24.05% |
| 24-Feb-23 | 35.55% | 24.61% | 34.21% | 24.05% |
| 03-Mar-23 | 24.16% | 26.56% | 27.54% | 24.05% |
| 10-Mar-23 | 19.99% | 22.85% | 26.82% | 24.05% |
| 17-Mar-23 | 18.52% | 21.27% | 26.82% | 24.25% |
| 24-Mar-23 | 18.88% | 21.45% | 25.66% | 24.25% |
| 31-Mar-23 | 19.39% | 21.46% | 25.66% | 24.25% |
- Ghana’s annual inflation rate saw a decline for the fourth consecutive month in April 2023, dropping to 41.2%. This decrease follows a previous rate of 45% and a peak of 54.1% in December, which was the highest inflation rate in more than 20 years. The improved stability of the Ghanaian cedi since January, along with the anticipation of finalizing a deal with the International Monetary Fund (IMF) or receiving a $3 billion bailout, has contributed to this downward trend. In April, food inflation eased from 50.8% to 48.7%, and non-food prices also grew at a slower pace, with an increase of 35.4% compared to the previous month’s 40.6%. On a monthly basis, consumer prices experienced a notable surge of 2.4% in April, the highest increase in four months, following a 1.2% decline in the prior month. Source: Ghana Statistical Service
- The projected outlook indicates a further slowdown in growth to 1.6% in 2023, followed by a period of subdued growth in 2024, before gradually returning to its potential. The non-extractive sectors are expected to experience sluggish growth, primarily due to challenges faced by the agricultural sector such as high input prices and the impact of a disease affecting cocoa trees. On the other hand, the extractive sectors, particularly with the emergence of new gold mines and recovery in small-scale mining, are expected to exhibit robust growth.
- Increased vulnerability in the banking sector has been observed due to the depreciation of the cedi and the consequences of a domestic debt exchange (DDE) that took place in February 2023. The implementation of the DDE is expected to have repercussions on Ghana’s financial sector, primarily because banks, insurance companies, and pension funds have substantial exposure to government debt. It is estimated that these entities hold approximately 42.1% of the government’s domestic debt.


