


- GOIL Company Profits Halve Despite Revenue Growth in Q2 2025
Ghana’s leading indigenous oil marketing company, GOIL PLC, reported a sharp slowdown in profitability for the second quarter of 2025, as rising operational costs and high finance charges offset the modest revenue growth achieved in a challenging downstream petroleum market.
According to the company’s unaudited results for the period ended June 30, 2025, revenue growth was insufficient to prevent a steep fall in net earnings, underscoring the vulnerability of Ghana’s downstream sector to thin margins and elevated borrowing costs.
Performance Overview: Revenue Up, Profit Down
GOIL’s company-level revenue rose 6.8% year-on-year to GHS 5.31 billion in Q2 2025, driven primarily by higher fuel volumes and marginal pump price adjustments. For the half-year, revenue totaled GHS 9.62 billion, up from GHS 9.33 billion in H1 2024.
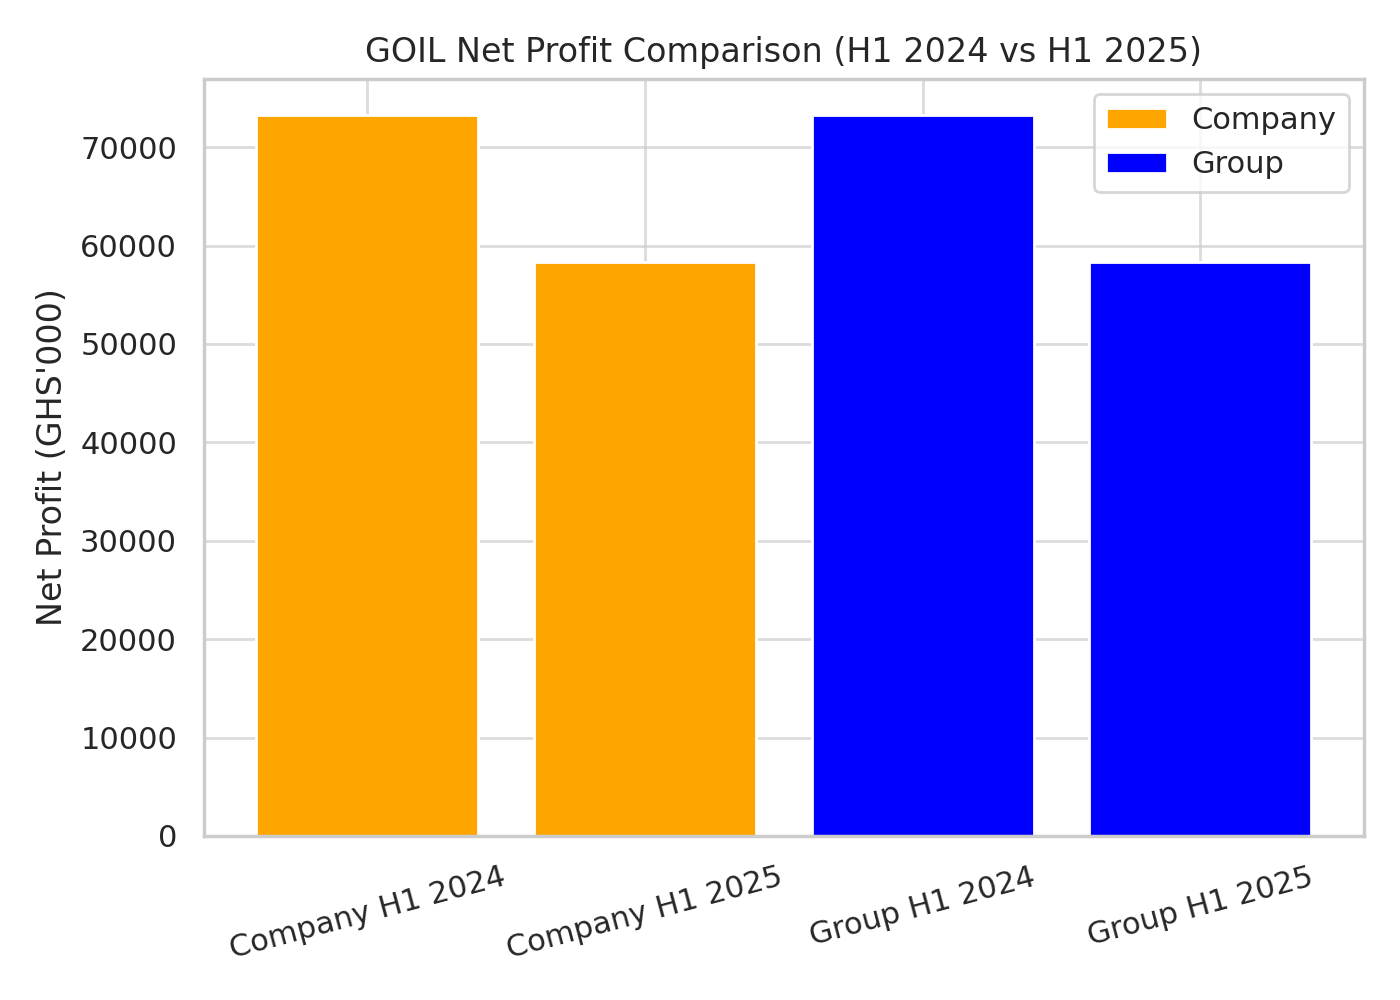
However, revenue growth did not translate into stronger profitability. Net profit attributable to shareholders fell to GHS 13.59 million in Q2, down 55.7% from GHS 30.69 million a year earlier. On a half-year basis, profit shrank to GHS 30.69 million, less than half the GHS 73.30 million earned in H1 2024.
This contraction reflects persistent industry headwinds, including:
- Thin gross margins on fuel sales,
- Rising administrative and selling expenses, and
- A high-interest-rate environment affecting working capital financing.
Earnings per share (EPS) fell to GHS 0.035 in Q2 2025, down from GHS 0.078 in the same period last year, signaling the impact on shareholder value.
Table 1: GOIL Company Key Financials
| Metric | Q2 2025 | Q2 2024 | H1 2025 | H1 2024 |
| Revenue (GHS’000) | 5,308,497 | 5,258,008 | 9,617,425 | 9,334,424 |
| Gross Profit | 292,301 | 290,252 | 418,488 | 383,897 |
| Operating Profit | 78,654 | 107,797 | 138,295 | 174,300 |
| Finance Costs | 60,530 | 66,876 | 60,530 | 73,664 |
| Profit Before Tax | 18,124 | 40,921 | 77,765 | 100,636 |
| Net Profit | 13,593 | 30,691 | 30,691 | 73,298 |
| EPS (GHS) | 0.035 | 0.078 | 0.149 | 0.187 |
Cost & Margin Analysis: OPEX and Interest Erode Gains
While gross profit remained relatively flat at GHS 292.3 million in Q2 2025, operational efficiency weakened. General, selling, and administrative expenses rose to GHS 237.1 million, compared to GHS 224.4 million in Q2 2024, reflecting inflationary pressures and higher logistical costs in the petroleum distribution chain.
Operating profit before finance charges fell 27% to GHS 78.65 million, highlighting the squeeze on core margins. Finance costs, at GHS 60.53 million, remained significant as the company continues to rely on short-term borrowing to manage working capital amid delayed receivables and the high-interest-rate environment in Ghana.
Balance Sheet & Cash Insights
The company closed the period with a total equity of GHS 595.13 million, up slightly from GHS 564.64 million at the start of the year, reflecting retained earnings.
However, the modest equity growth contrasts with the high cost of debt servicing, suggesting that GOIL’s balance sheet is carrying substantial short-term obligations. The persistence of finance charges consuming nearly 44% of operating profit is a warning sign for future cash flow sustainability.
Strategic & Market Implications
GOIL’s second-quarter performance reveals a broader challenge for Ghana’s downstream petroleum sector: volume growth is not translating into strong bottom-line performance. The company faces a strategic inflection point, requiring:
- The company needs to diversify into higher-margin products like lubricants, bitumen, and LPG to boost its profitability.
- The company also needs to strengthen its working capital management to lower interest expenses.
- Initiatives for cost containment aim to mitigate the inflationary influence on distribution and operations.
Market observers note that the state’s regulatory interventions in fuel pricing and the volatility of global oil markets continue to compress marketing margins. For investors, GOIL’s short-term earnings outlook appears cautious, with upside potential dependent on non-fuel revenue growth and cost efficiency.
Infographic Reference
To visually illustrate the profit contraction, NorvanReports has prepared a net profit comparison chart for H1 2024 vs H1 2025, highlighting the steep year-on-year decline:
Outlook
GOIL’s Q2 2025 company results serve as a cautionary tale of margin pressure in Ghana’s downstream sector. Unless the company accelerates its shift toward profit-rich product lines and tightens its balance sheet, profit recovery in the second half of 2025 will remain elusive.


