


5 year performance of GCB equity on the Ghana Stock Exchange
Investing in shares or stock or equity should be done with a long term view, this is because historically, the stock market outperforms all other asset classes particularly the traditional asset classes being T-Bills and bonds in the long term, beating inflation and recording significant returns.
The stock market is known to record over 110% returns on equity investments (capital appreciation) during bullish market periods which lasts averagely for four (4) years.
To realise or achieve significant capital appreciation or gains in share or equity price, investors are advised to continuously invest in the stock market for not less than five (5) years.
Hence, investments into a particular equity for at least five (5) years is ample time to assess its performance, at least over the medium-term.
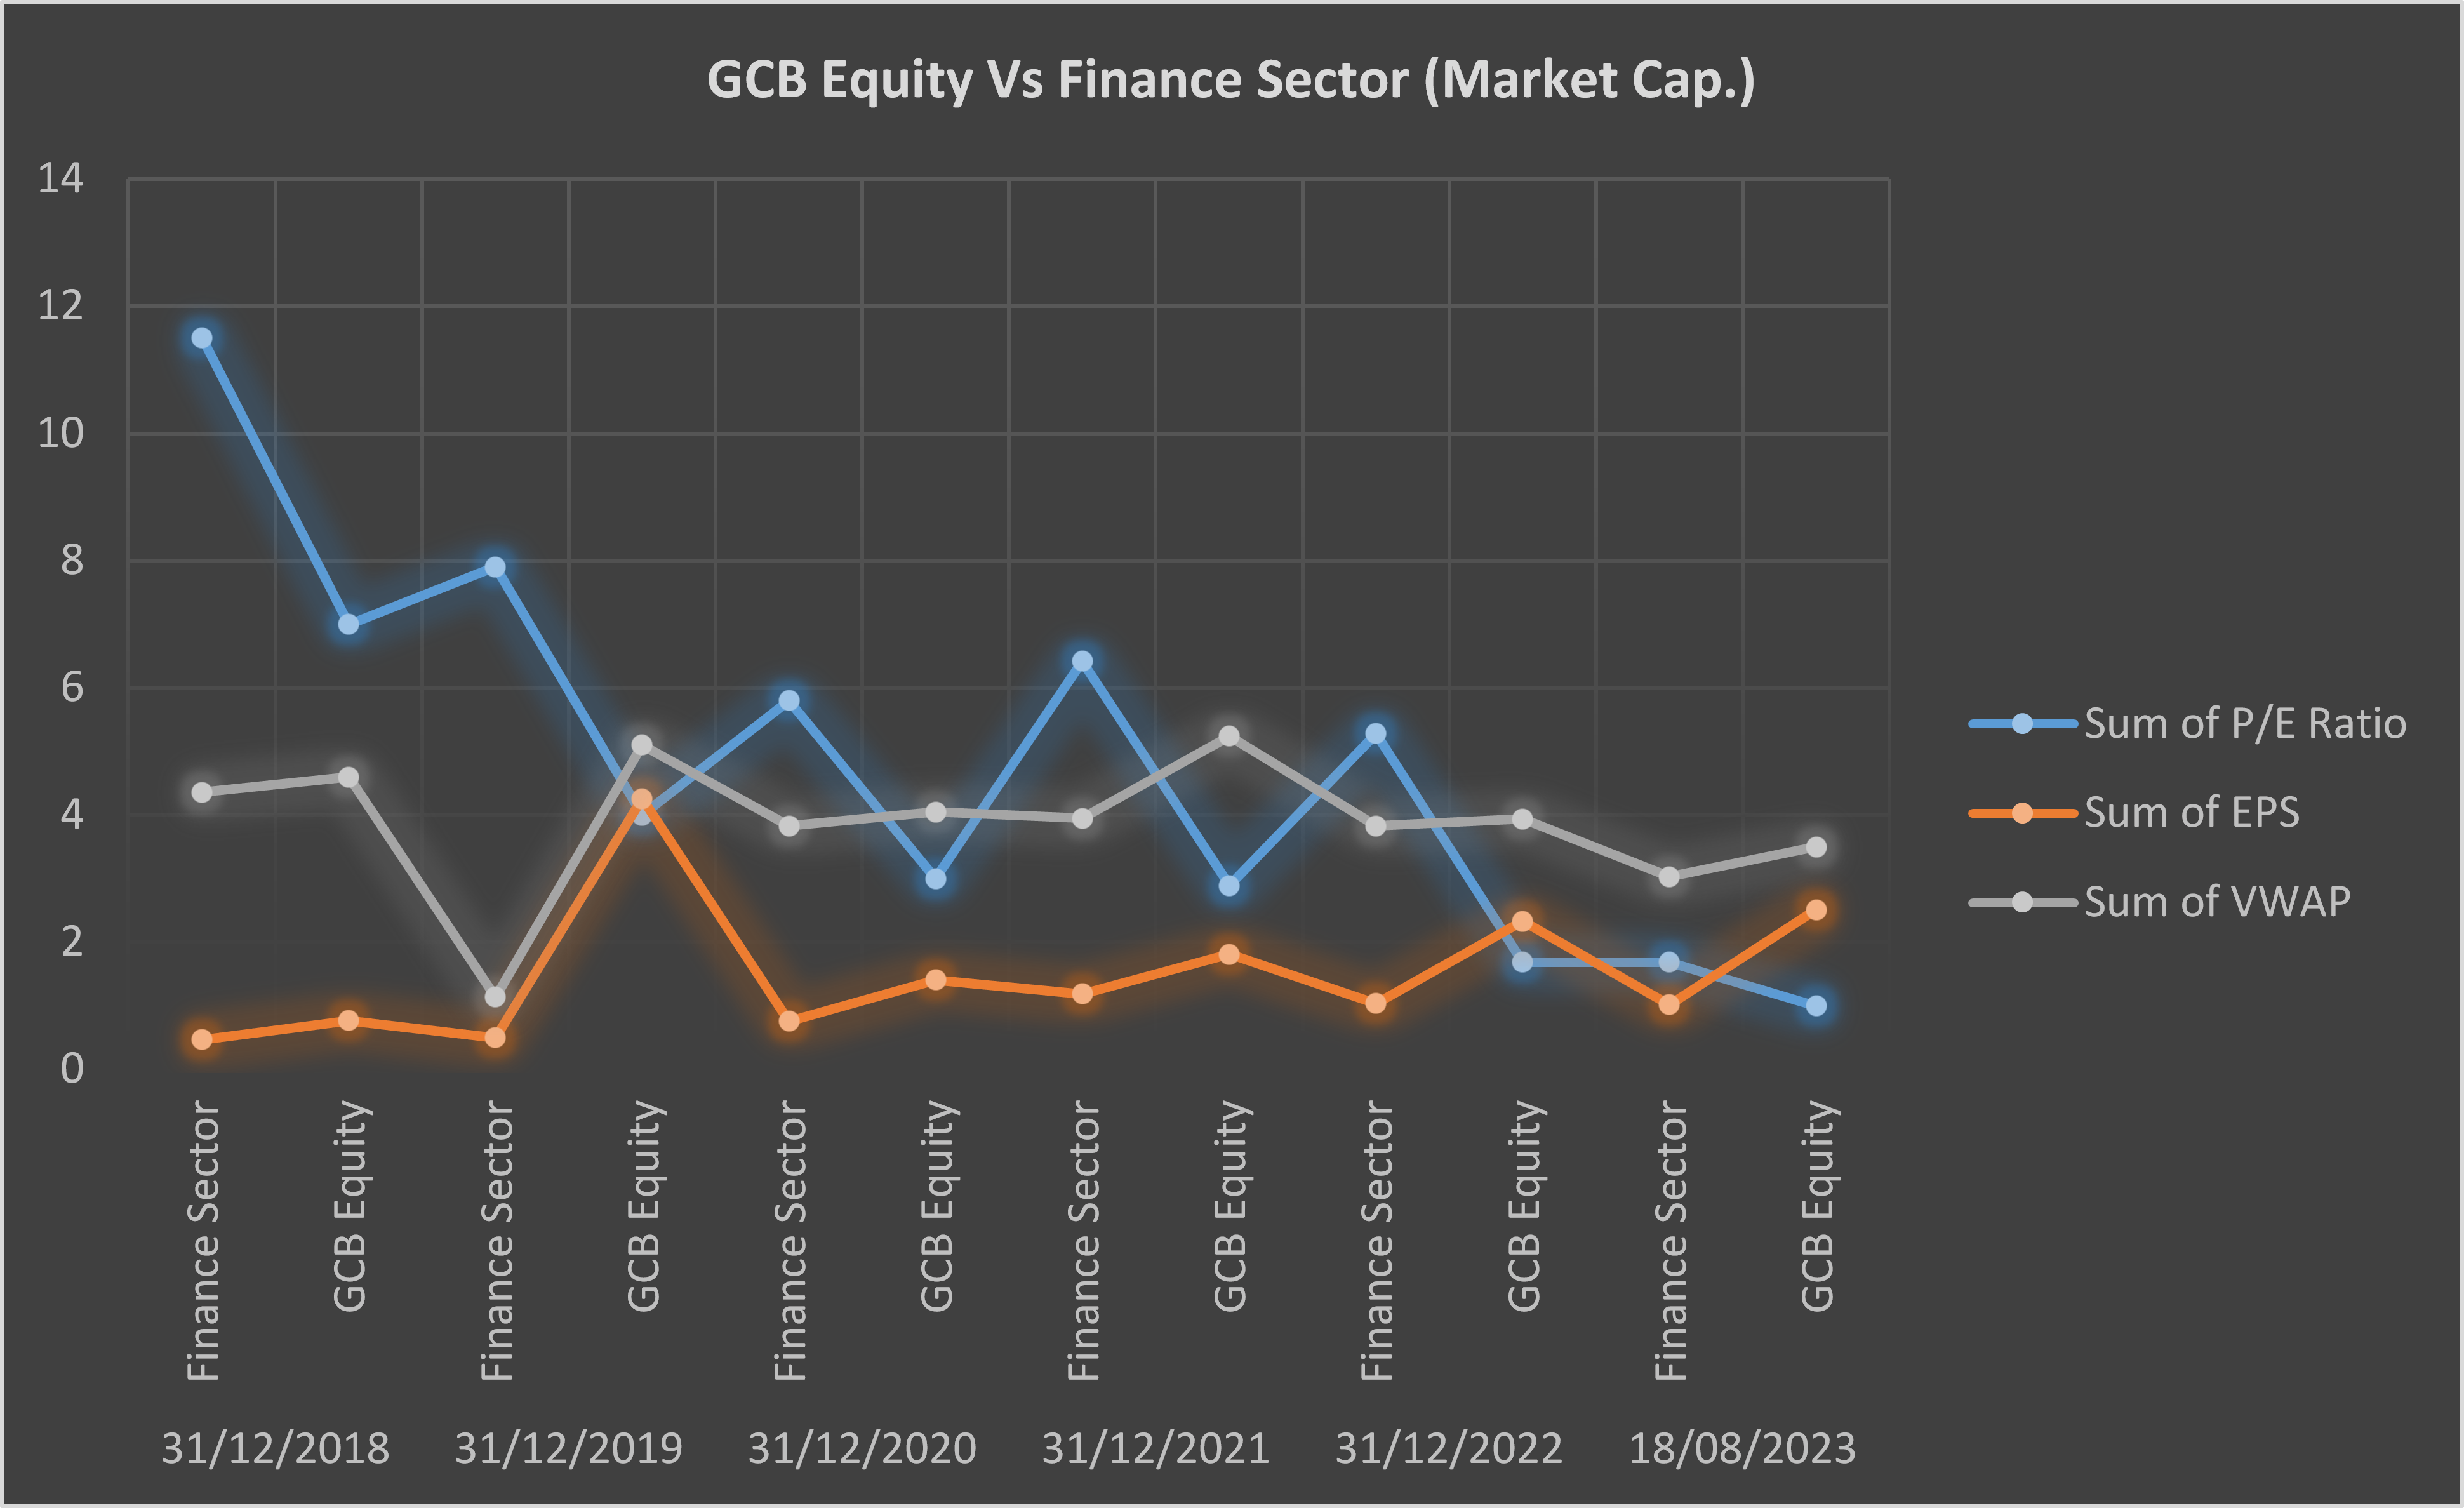
In this write-up, the five year performance of listed equity of State-Owned Bank, GCB, will be analysed looking at its market capitalization, volume-weighted average price (VWAP), earnings per share and price-earning ratio (P/E ratio).
EPS
Earnings per share (EPS) is used to evaluate a company’s profitability and potential for growth in earnings. It is a measure of how much profit a company generates per share.
The higher the EPS, the more profitable a company is and the more attractive it is to investors.
GCB has over the last five years (including the 8 months period of 2023), recorded high EPS above the overall average EPS of the various financial companies listed on the GSE.
In 2019 for instance, the EPS of GCB equity (GHS 1.14) was more than twice (127.9%) the average EPS (GHS 0.50) of listed financial stocks.
Same was the case in 2022 when EPS of GCB equity (GHS 2.33) outperformed the average EPS of listed financial stocks (GHS 1.04) by +12,400bps (124%).
EPS of GCB equity which currently stands at GHS 2.51 is +14,600bps (146%) higher than the average EPS of listed financial equities which stands at GHS 1.02.
The import of GCB equity consistently recording a higher EPS above the average EPS for listed financial stocks is that, in terms of profitability over the last five year period, GCB has performed relatively well compared to its peers, making it attractive to investors.
VWAP
The Volume-Weighted Average Price (VWAP) of GCB equity, simply measures the average price of the stock/equity over a period of time which is usually a full trading day.
VWAP is a single-day technical analysis indicator used in intraday charts that restarts at the open of each new trading day.
VWAP helps investors and analysts evaluate the current price of a stock to determine whether it is relatively overpriced or underpriced compared to the average trading price for the day. Often investors use this information to either buy or sell an equity or share or stock during the day’s trading session.
When the average trading price (VWAP) of an equity is below the overall average trading price of listed equities on a bourse, that particular equity is seen as underpriced or undervalued by investors. In the same vein, when the average trading price (VWAP) of an equity is above the overall average trading price of listed equities on a bourse, that particular equity is seen as overpriced or overvalued by investors.
Investors then tend to buy (enter) the equity when it is underpriced and cheap to later sell (exit) the equity when it is overpriced and expensive, thereby making some capital gains.
Over the last five years – 2018 to 2022 – the average trading price (VWAP) of GCB equity has consistently outperformed the overall average trading price (VWAP) of financial equities (shares of banks and other financial institutions) listed on the Ghana Stock Exchange (GSE).
The average price of GCB equity on the last trading day of 2019 for instance, was GHS 5.10, some +1,970bps (19.7%) higher than the overall average price of GHS 4.26 for financial equities listed on the local bourse.
At end-2021, GCB equity recorded a much higher average price of GHS 5.24 which was +3,260bps (32.6%) higher than the GHS 3.95 overall average price recorded by the financial equities.
As at August 18, 2023, the VWAP of GCB equity stood at GHS 3.50, some +1,550bps (15.5%) higher than the GHS 3.03 VWAP of all listed financial equities.
Given that the average trading price (VWAP) of GCB equity is mostly higher than the overall average trading price (VWAP) of listed financial stocks, the GCB equity has been viewed as relatively over-priced by investors over the five year period.
P/E Ratio
The P/E ratio is indicative of how investors value a company’s ability to grow its income in the years ahead, a higher P/E ratio means investors expect higher income growth from the company whereas a lower P/E ratio implies that investors do not expect high income growth from the company.
The P/E ratio is also indicative of how much cedis investors are willing to pay or invest in a company by way of shares acquisition in order to receive or earn GHS 1 of the company’s earnings or profit.
What this means is that, if for instance, a company is currently trading with P/E ratio of 10, then the interpretation is that an investor is willing to pay GHS 10 for the company’s shares to receive GHS 1 of the earnings of the company when it makes a profit.
Now, contrary to the higher-than-average EPS recorded by GCB equity over the last five years, P/E ratio of the equity remained below the average P/E ratio of listed financial equities.
P/E ratio of GCB equity from 2018 to 2022 on year-on-year (yoy) basis declined from 7 to 4 to 3 to 2.89 and then to 1.69 at end-2022.
For the eight months period of 2023, the P/E ratio of GCB equity is currently 1.
The decline in P/E ratio of GCB equity was reflective of the general decline in the average P/E ratio of listed financial equities.
In 2018, the P/E ratio of GCB equity stood at 7 which was -6,420bps (64.2%) lower than the average P/E ratio of 11.5 for listed financial equities.
In 2022 however, the average P/E ratio of listed financial equities had dropped to 5.28 as against the 1.69 P/E ratio for GCB equity.
The fall in average P/E for listed financial equities from 11.5 to 5.28 indicates a -5,408bps (54.08%) drop in average P/E ratio over the five year period.
The continuous fall in the P/E ratio of GCB equity from 7 in 2018 to 1.69 in 2022 is indicative of investors declining optimism in the company’s ability to record higher income growth in the years ahead.
It is also indicative that investors are willing to pay or invest less and less money into the bank by way of shares acquisition in order to receive GHS 1 of the company’s earnings or profit.
Market Capitalization
Market capitalization of GCB equity as at 2018 was GHS 1,219m representing 8.6% share of the GHS 14,167m total market capitalization of listed financial equities on the local bourse.
The total market capitalization of GHS 14,167m for financial equities represented 23.17% of the GSE’s total market capitalization of GHS 61,136m in 2018.

As at 2022, the market capitalization of GCB equity was GHS 1,044m representing 7.57% share of the GHS 13,774m total market capitalization of listed financial equities.
Market capitalization of GCB equity as at August 18, 2023 stood at GHS 928m which represents 7.88% share of the GHS 11,770m total market capitalization of financial stocks.
Currently, the total market capitalization of the GSE stands at GHS 72,998m of which the total market capitalization of financial equities constitute 16.12% share of the overall equity market.
Over the last five years, GCB equity’s share of the total market capitalization of listed financial equities has ranged from 7.5% to 11%.
Changes in the market capitalization of GCB equity and consequently its share of the total market capitalization of listed financial equities is on the back of the volatility in the share price of the equity.


